
Business Statistics Formula Handbook
Table of Contents
Measures of Central Tendency – MEAN, MEDIAN, MODE
MEAN – It is the average of a given set of observation.
Ungrouped data
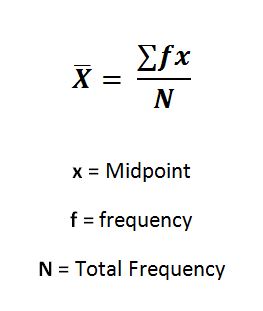
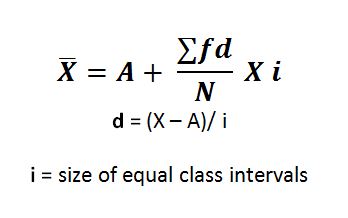
Grouped data
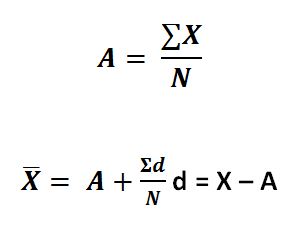
Direct Method:
Shortcut Method:
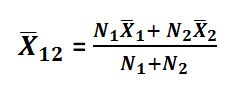
Combined Mean:
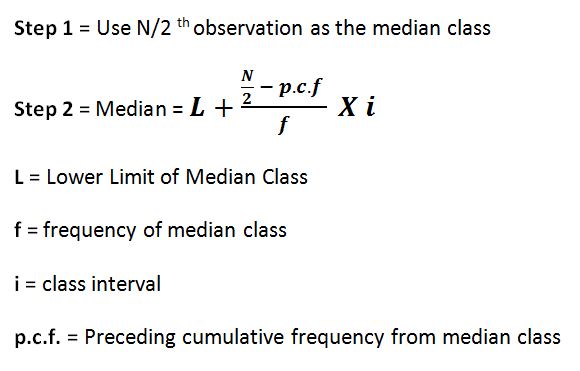
MEDIAN – It is the middle value of an observation
Ungrouped data:
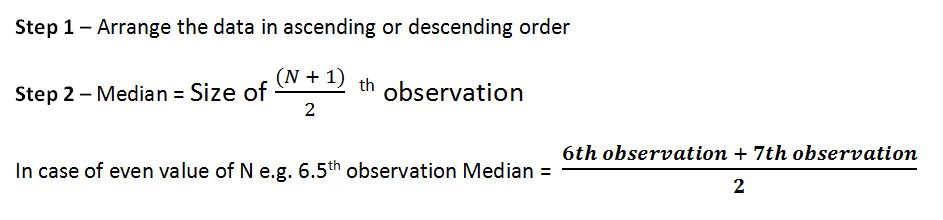
Grouped data:
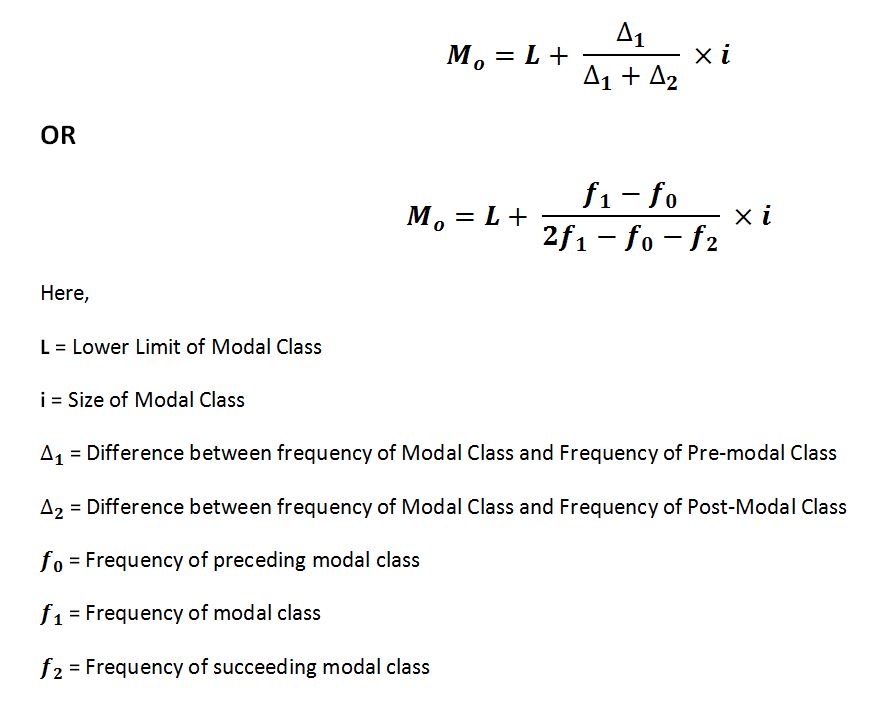
MODE – It is the value which occur the maximum number of times in a data
Ungrouped data:
Mode is the value which has the highest frequency.
Grouped data:
Relationship between Mean,Median and Mode
![]()
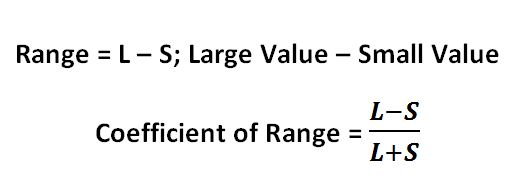
Measures of Dispersion
Range: It is the difference between the value of smallest observation and largest observation in a data.
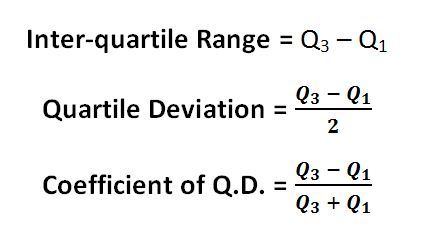
Quartile Deviation:
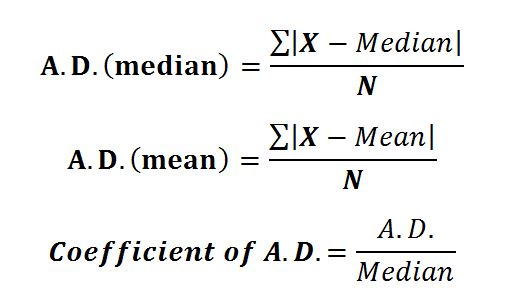
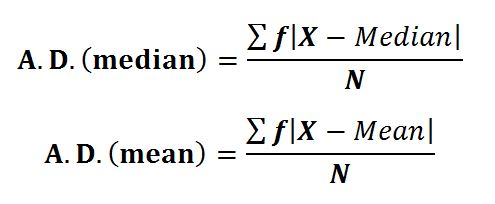
Average Deviation:
Ungrouped Data:
Grouped Data:
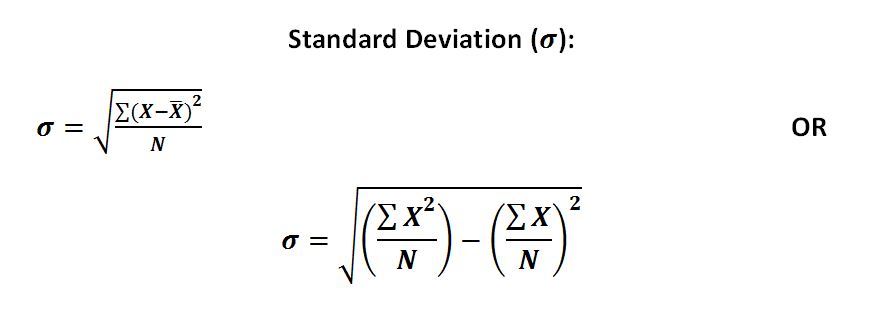
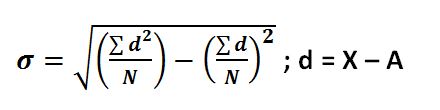
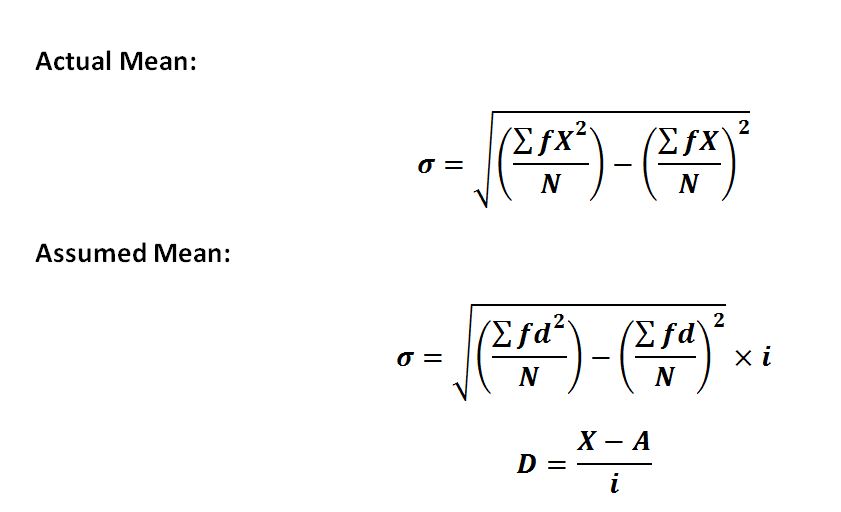
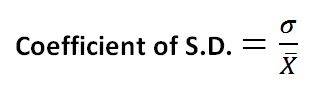
Standard Deviation:
Ungrouped Data:
Assumed Mean Method:
Grouped Data:
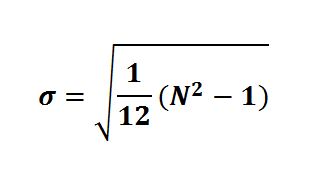
S.D. of Natural Numbers:
Variance:
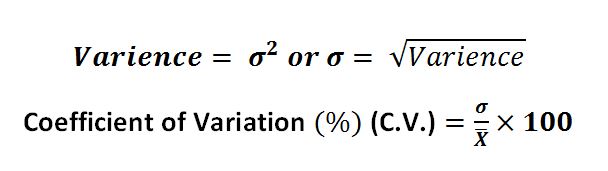
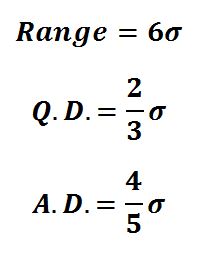
Relationship between Measures of Variation:
Correlation
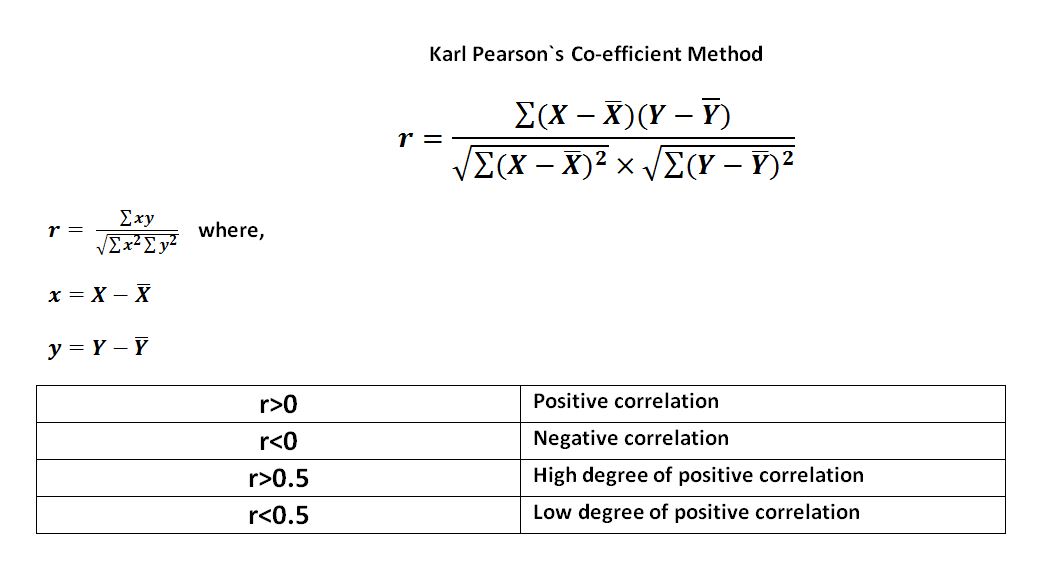
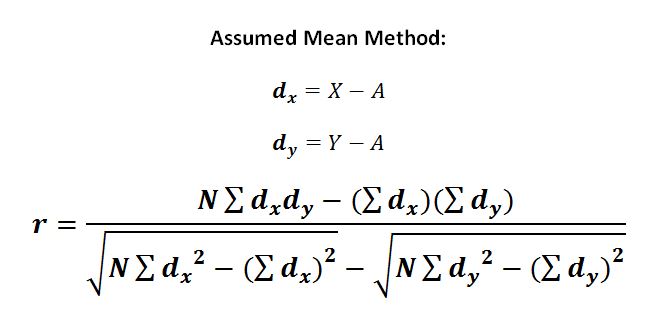
Karl Pearson`s Co-efficient Method:
In case of Grouped data:
Spearman`s Rank Coefficient:
![]()
Regression Analysis
Regression Equation of Y on X:
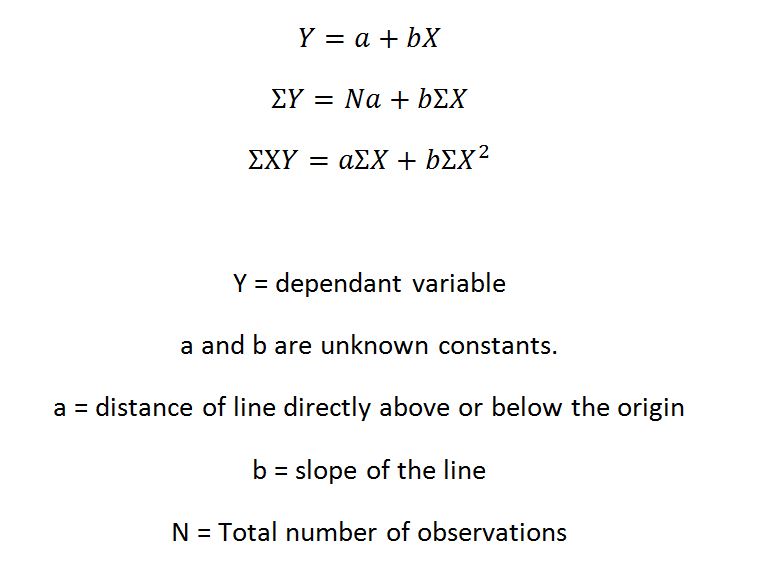
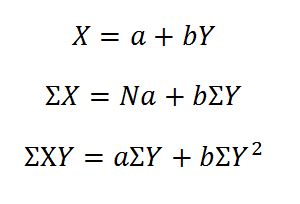
Regression Equation of X on Y:
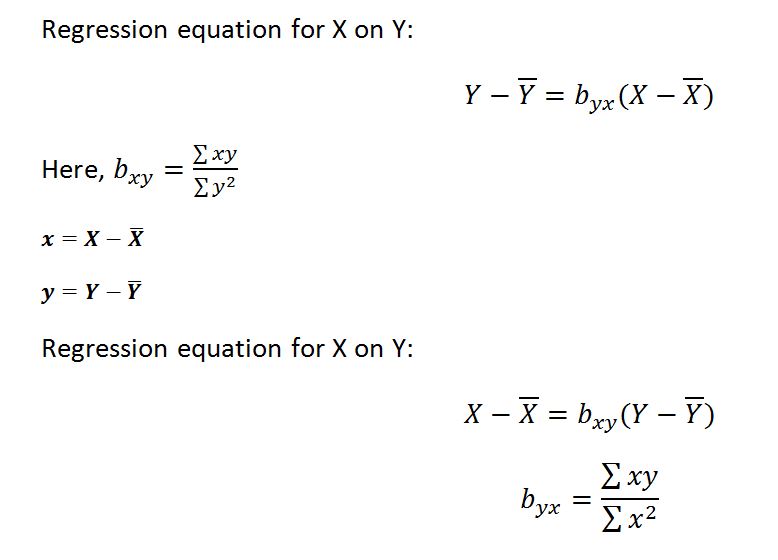
If deviations are taken from mean:
If deviations are taken from assumed mean:
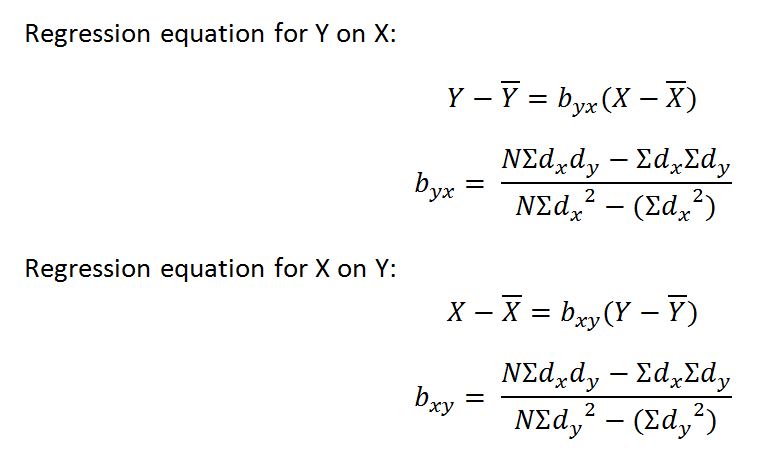
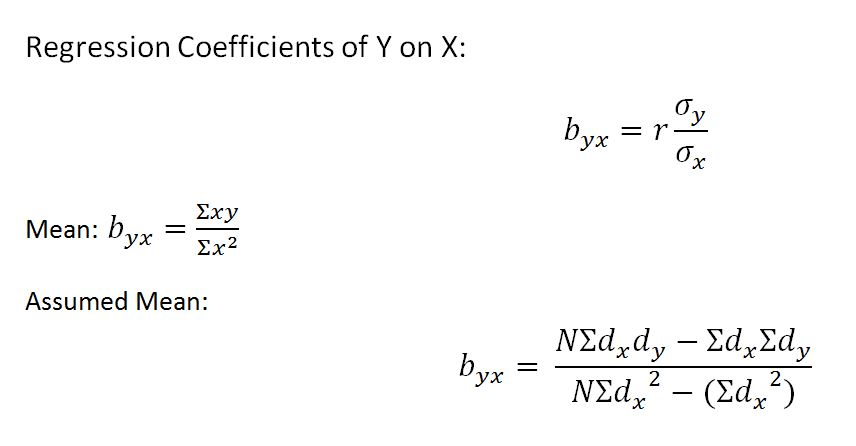
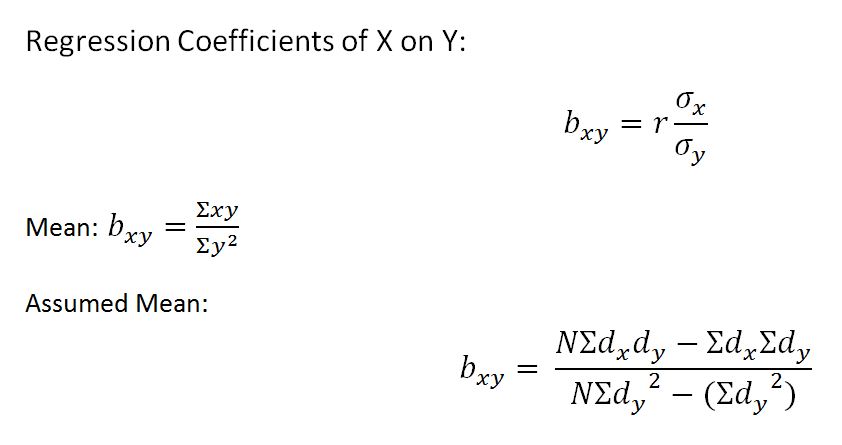
Regression Coefficients:
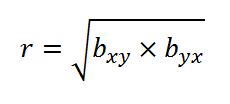
Relation between coefficient of correlation and two regression coefficients:
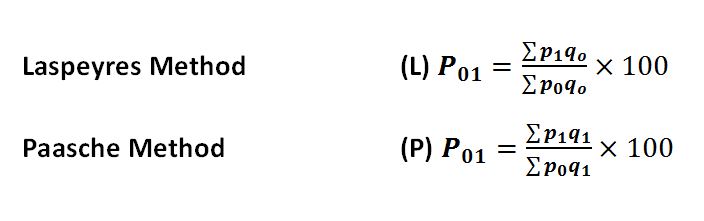
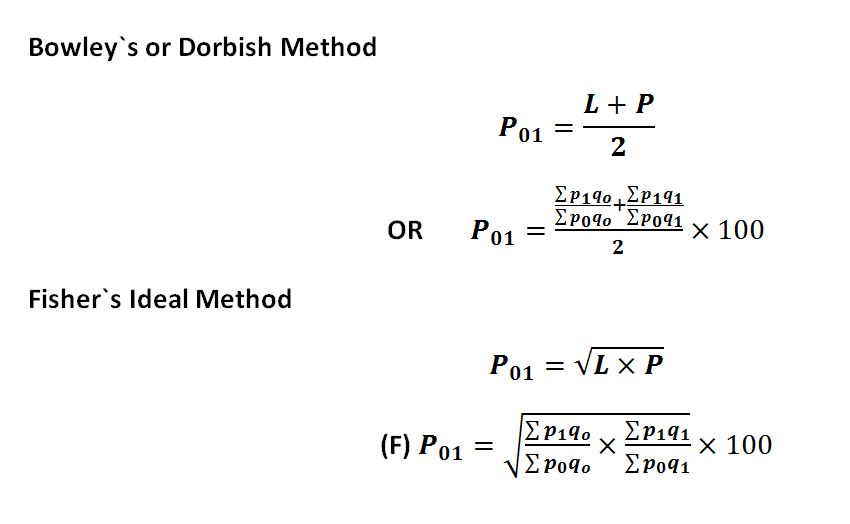
Index numbers
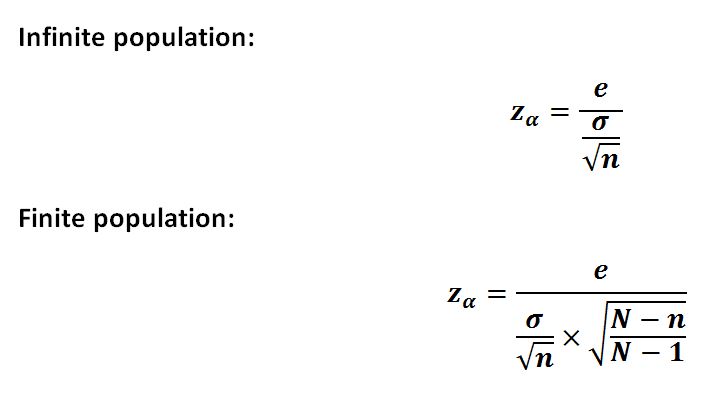
Sampling
Mean:
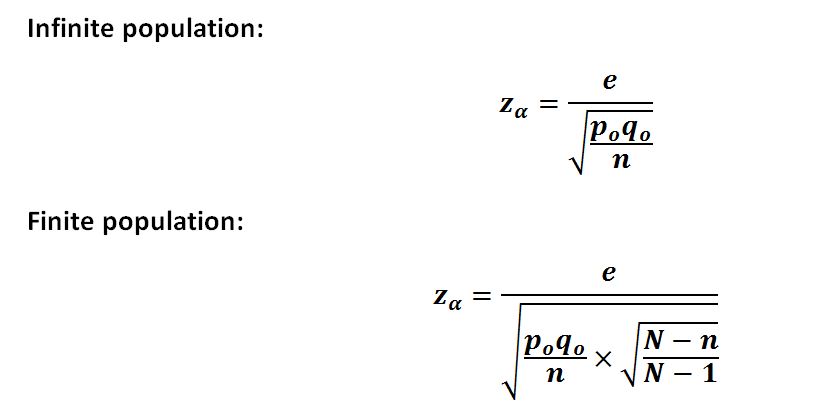
Proportion:
Test of Hypothesis
Alternate Hypothesis – H1
Size of Sample – n
Types of Tests – One tailed, Two Tailed, Right tailed, Left tailed
| Sign | Type of Test | Keyword to look for |
| ≠ | Two tailed Test | Or Not, always, never |
| < | Left Tailed Test | Higher than, More than, Increased |
| > | Right Tailed Test | Lower than, Less than, Decreased |
Process:
- Formulate the hypothesis
- Set the significance level
- Decide the Test Statistic (z,t)
- Find out the critical value
- Make a conclusion
Use Z statistic when sample size is > 30
Use T statistic when sample size is < 30 and/or Standard Deviation is Unknown
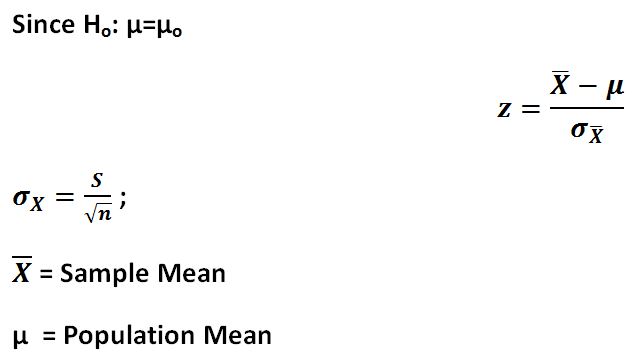
Calculation of Z statistic
Mean
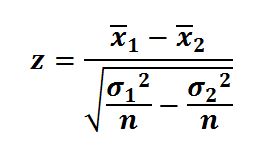
Difference of two mean
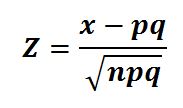
Counting
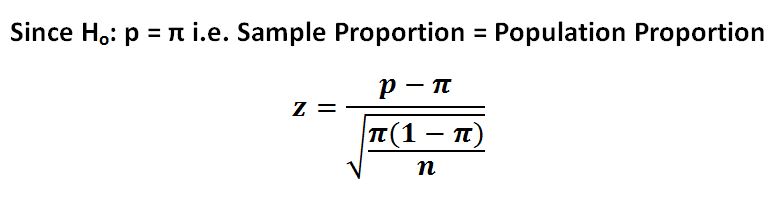
Proportion
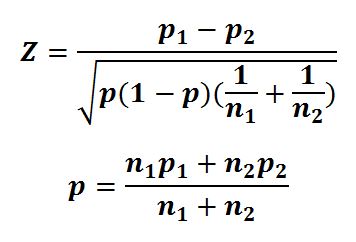
Difference of two Proportions
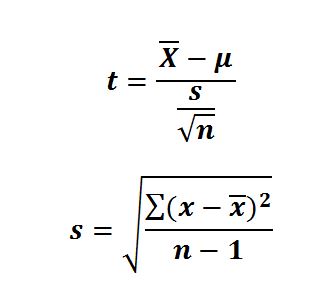
Calculation of T statistic:
Mean:
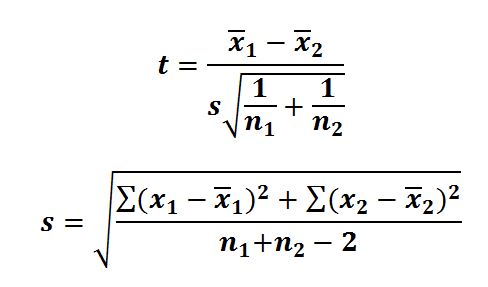
Difference in two mean
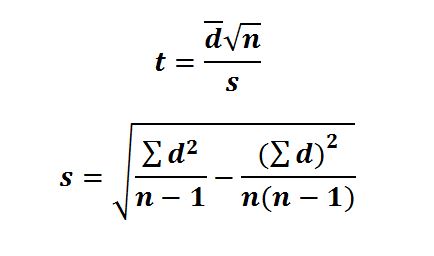
Difference of two means with dependent samples
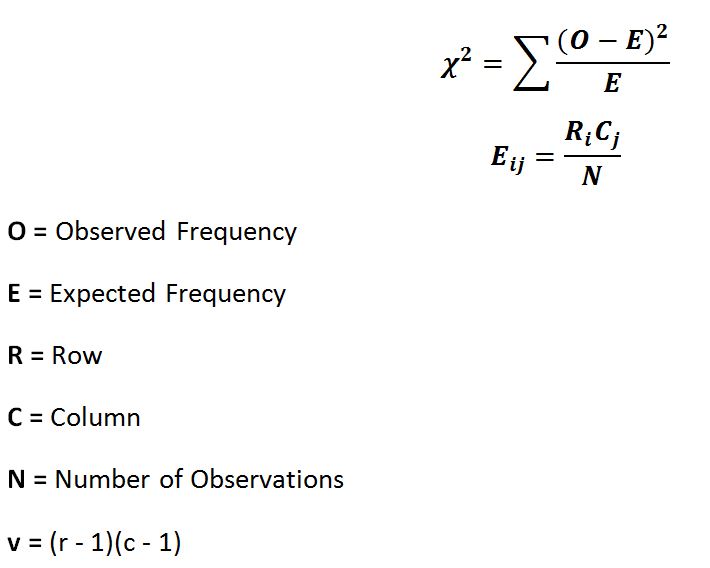
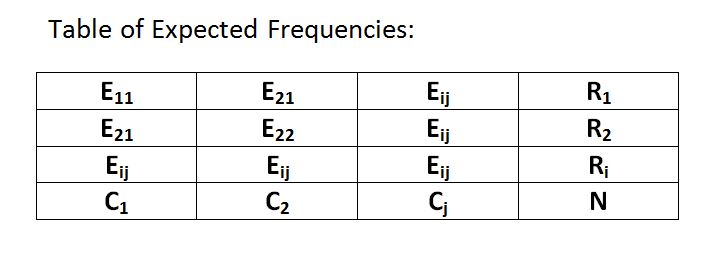
Chi Square Test
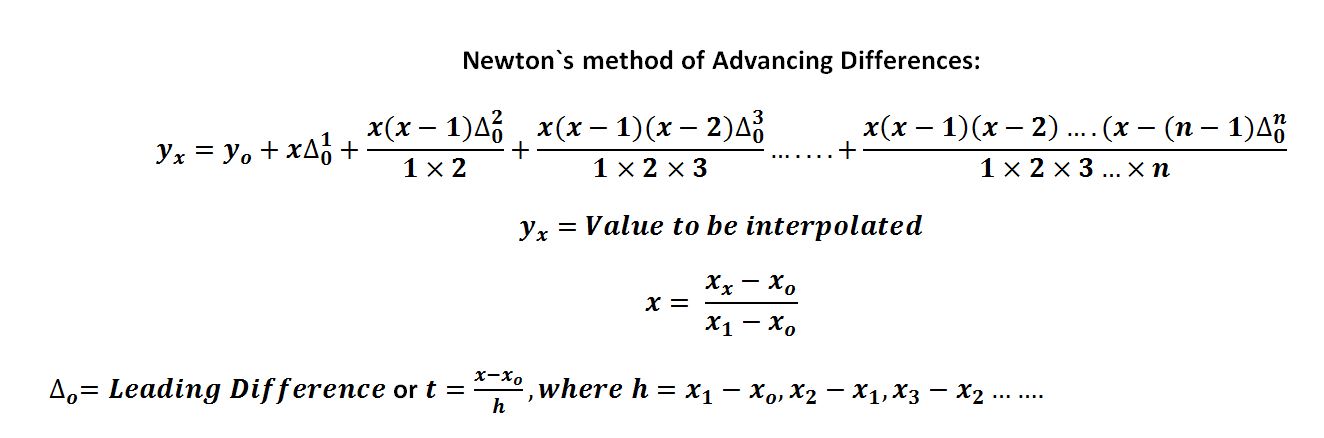
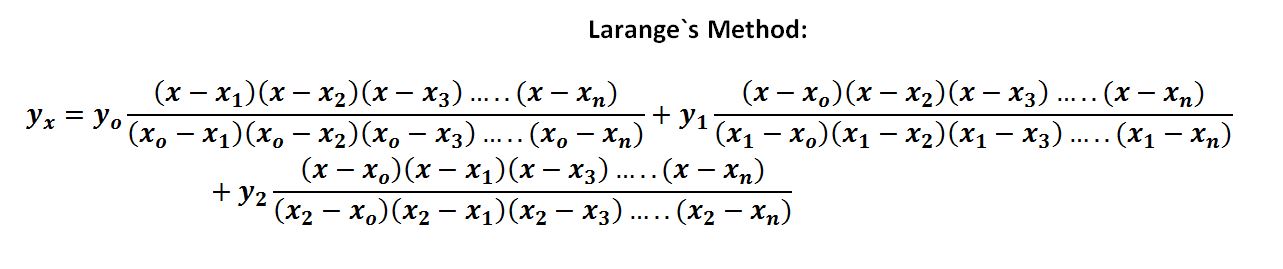
Interpolation
Extrapolation

How Can I Download This Formulas?
Hi, To protect our content from misuse, we do not allow users to copy or download our content, But you can always bookmark (CTRL + D) any webpage for instant access or share it with yourself or your friends via various social networks.
HOW I CAN GET THE PDF OF THESE NOTES
i cant able to copy this formula you should give another one